

Untitled (choreographic sketch by by Trisha Brown, 1980)
Network Maps, Energy Diagrams
Structure and Agency in the Global System
La produccion de la nueva geografia, requiere de una serie de nuevos dispositivos de realidad. Es decir este nuevo paradigma reacciona y replaneta no solo una forma deconstruccion de relaciones tanto culturales como sociales. Esta vision GLOCAL es muy importante pues las condiciones tectonicas , las capacidades de las nuevas tecnologias han construdio un hecho, una realidad multiple absolutamenbte evidente pero tambien invisible en sus redes de vinculos y a su vez en el poder de representatividad que estas tiene, es decir ahora con estas nuevas geografias como se representa esta nueva sociedad? cuales son sus espacios de legitimizacion? como son estos espacios de regeneracion, de re-apropiacion y de re-formulacion cultural?
---------------
The Internet is the vector of a new geography – not only because it conjures up virtual realities, but because it shapes our lives in society, and shifts our perceptions along with the ground beneath our feet. Networks have become the dominant structures of cultural, economic and military power. Yet that power remains largely invisible. How can the networked society be represented? And how can it be navigated, appropriated, reshaped in its turn?
Reflecting in the early 1980s on the spatial chaos that technological and financial developments had impressed upon contemporary cities, Fredric Jameson pointed to the need for “an aesthetics of cognitive mapping” to resolve “the incapacity of our minds, at least at present, to map the great global multinational and decentered communicational network in which we find ourselves caught as individual subjects.” He conceived this cartographic aesthetics as a collective pedagogy, whose challenge would be to correlate the abstract knowledge of global realities with the imaginary figures that orient our daily experience. Epistemological shifts, pushed forward by the use of sophisticated technical instruments, would need to be paralleled by the deployment of radically new visual vocabularies, in order to produce a clearer understanding of contemporary symbolic relations (social roles, class divides, hierarchies) and a fresh capacity for political intervention in the postmodern world. Only by inventing “some as yet unimaginable new mode of representing” could we “again begin to grasp our positioning as individual and collective subjects and regain a capacity to act and struggle which is at present neutralized by our spatial as well as our social confusion.”1
Twenty years later, what has become of the mapping impulse? What new forms of cartography have arisen to chart the virtual/real spaces of the present? What kinds of agency do they permit? What modes of social organization do they foster? Can critical and dissenting maps be distinguished among the established and dominant ones?


Skitter Graph / Centers & Peripheries (click for enlargements)
Let’s start by looking at an impressive technical and aesthetic feat: the “Skitter Graph” by the Cooperative Association for Internet Data Analysis (Caida) – an academic offshoot of the military-industrial complex, based in the city of San Diego. This map shows a record of peering sessions between some 12,500 “autonomous systems” (basically equivalent to Internet Service Providers, or ISPs).2 To produce it, twenty-five different monitoring points run a “traceroute” program known as Skitter over a period of two weeks, following packets from over 1,100,000 IP addresses. The researchers analyze the path of the packet stream, which is only considered significant when it goes outside its autonomous system of origin. Information from the Border Gateway Protocol database is used to track each message back to a localized ISP. The graph displays the major link lines between the autonomous systems, and represents the quantity of outgoing connections per ISP, placing the lower values on the edges, in light blue, with higher intensities as you move toward the center, in dark blue, violet, orange and finally yellow. But to give all this data the form of a world map, it is also organized by the geographical location of the ISPs – or at least, their head offices – which are distributed around the circle according to longitude.
The autonomous systems fall into three major groups. At the bottom are those in North America — from San Jose and Vancouver to the Eastern seaboard — clearly dominating the Western hemisphere. Slightly further east are two exceptions: Buenos Aires and Sao Paulo/Rio, indicating the only significant connectivity in South America. Next comes Europe, with a great arc of ISPs stretching from London to Moscow; Pretoria falls in the middle, the one African city to be mentioned. On the upper left is Asia, with peak intensities in Tokyo, Seoul and Hong Kong, and lower values in Singapore, Perth and Sydney. The immensely productive population of mainland China barely shows up on this map of outgoing connections.
The Skitter Graph presents the raw facts of location and transmission: a geography of unqualified information flow. But what does it tell us about social relations? It can be compared to the map of “Centers and Peripheries,” elaborated by the geographer Denis Retaillé in 1992 and published in a 1994 volume on the “globalization of capital” by the economist François Chesnais.3 This map shows three things. First, a circuit linking the United States, Western Europe and Japan, the so-called “Triad” regions, which form a “global oligopoly” accounting for the majority of industrial and financial exchanges. Second, the major nodes of the world network, represented by densely outlined circles. And third, the hierarchical relations between the regions, as described with these categories: center; periphery integrated to the center; annexed periphery; exploited periphery; abandoned periphery. Chesnais performs a Marxist analysis, showing how globally fragmented production lines are coordinated through the computerized circuits of the financial sphere. His map describes the hierarchy of social relations in a post-national era, when no political formation can erect any substantial barrier to the dictates of capital. And it reveals the near-perfect correlation between the graph of virtual flows and the geography of human exploitation.
Having identified a dominant map, I now want to ask the political question. Where do the forces of resistance come from, and how do they gain agency in an era of planetary management and control?
To get an idea, you can log back onto the Caida site and look at an animated version of exactly the same information used in the Skitter Graph (try it here and refresh after the page has loaded for a few minutes, or better, download the flipbook animation). Each frame of this movie-map is a snapshot of Internet usage across the world during a few hours time; five different images were compiled every two days, over a period of some eighteen months. The result is an extraordinary visual experience. The ISPs turn green and advance toward the center as their connectivity increases; the link lines shift as the routing structure reconfigures to meet the moment’s demands. We watch the diurnal flux of the Internet, and feel the complex, disjunctive rhythm of the global information machine. It’s like the pulsing of a hive, a planetary brain: the cognitive and imaginary activity of untold millions of individuals, establishing far-flung connections. What the activation of the Skitter Graph reveals – as though despite itself – is the micro-political dimension of the global production system: not a stratified representation, but a generative diagram.
The visual spectacle of this animated map can help us to sense the presence of an underlying diagram, in the sense described by Gilles Deleuze: “a cartography that is coextensive with the whole social field.”4 The notion of the diagram, derived from Michel Foucault’s work on the microphysics of power, does not designate a static grid, a preconceived template for the application of a unified force. Rather it describes a productive matrix: a dynamic field where tensions culminate at an almost infinite number of heterogeneous points. Each of these ‘points’ – human beings, but also their material objects and inventions – is entwined in singular and evolving relations to others, relations of power that involve both constraint and freedom. From the interplay of such relations, functional patterns and statistical averages emerge. These can be codified as stratified ‘laws’ within the social sciences. They can be charted in a synoptic table, by representations like the Skitter Graph or the map of centers and peripheries. But beyond the stratified structures, the vital dynamics of each period arise from what Deleuze calls strategies, which can be understood as the generative moves of social experimentation.
Thus we can distinguish between a determinate network map — a geographical representation of structures of networked power, which attempts to identify and measure the forces at play – and an undetermined energy diagram, which opens up a field of possible agency. Deleuze describes the diagram of power as “highly unstable or fluid… constituting hundreds of points of emergence or creativity.” His aim is to indicate the openness, the possibility for intervention that inheres to every social relation, because of the limited but real power that flows through each of the participants. Thus at its point of application, where individual behavior is molded into functional patterns by the convergence of mutually reinforcing constraints, power can also fold in upon itself, producing resistance and alterity through its own redoubling in the subject, then its subsequent dispersal. This understanding of the way that social hierarchies can be altered or dissolved by a deliberate twisting or counter-application of the very forces that make them cohere was the fundamental breakthrough of French critical thinking in the late 1979s and early 1980s, going beyond the deterministic schemas of traditional Marxism (even that of Louis Althusser), but without abandoning the description of dominant structures. At stake here is a fundamental concept of resistance and exodus. Two decades later, that epistemological breakthrough has lent momentum to an aesthetics of critical and dissident cartography, capable of twisting the techniques and visual languages of network maps away from their normalized uses, and thereby pointing to a place for autonomous agents within the global information grid.
Jameson saw the correlation of abstract knowledge and imaginary figures as key to understanding contemporary symbolic structures, and regaining the capacity to act within them. A range of recent mapping projects, all dealing with the forms of social organization, will serve as exemplars of this process. They can be arrayed within a circle marked by four cardinal points and traversed by two major oppositions.

At the top of the compass, an initial group of maps offers critical depictions of hierarchically concentrated cultural, economic and military power. At its polar opposite, another group invokes swarms of self-organizing singularities. In the right-hand quadrant are diagrams of social networks in the process of constitution, represented either in their tendency toward the concentration of power, or in their moment of dispersion into all-channel meshworks. And in the left-hand quadrant, opposite these constitutive diagrams, we find the cartography of dissemination, which traces and effaces the footfalls of wanderers in the global labyrinth.
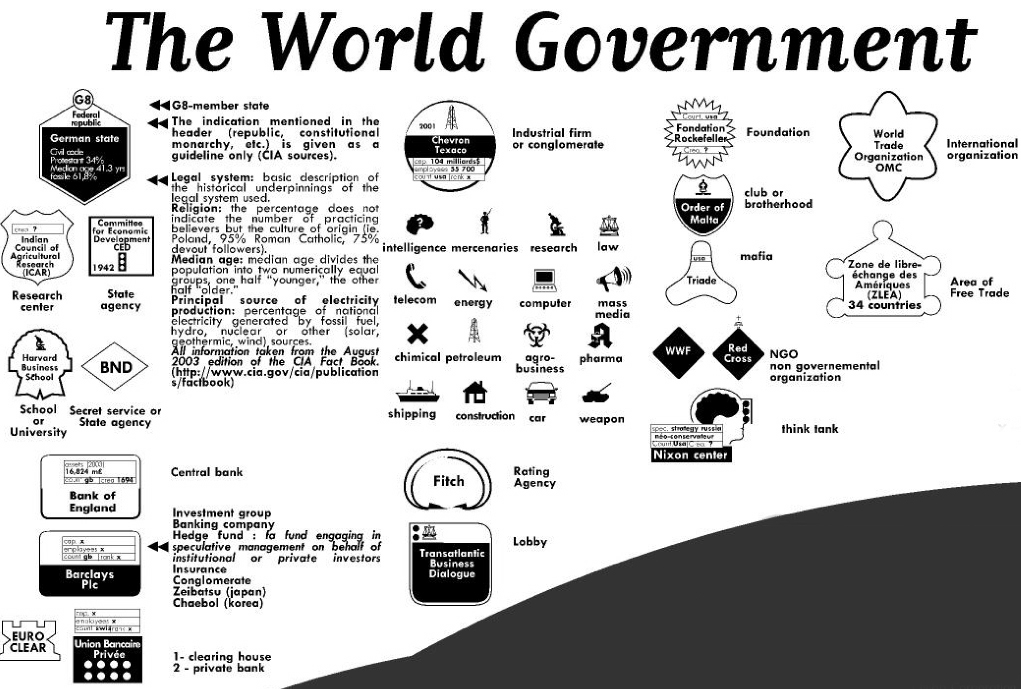
The cardinal examples of the first group are the flowcharts by Bureau d’Etudes, such as “The World Government” (2003), which can be seen as a culmination of the critical analysis of globalization carried out scholars and social movements since the early 1990s. This information map uses pictograms to represent over forty different categories of actors, linked into a continuous and contradictory network. At the center is a financial core, populated by transnational investment groups. Around these groups, in a structure of nested rings, are the most powerful nation-states, themselves subsumed under regional or strategic ensembles. Major industries, service providers and transnational organizations appear in direct or ambiguous relations to these blocs. The effect is one of arresting detail, compelling the eye to a seemingly endless iteration of links. But if you draw back, this extraordinarily complex map reveals rounded, almost cosmological forms, small enough to be seen in a single gaze.

“To understand a real thing in its totality we always tend to work from its parts. The resistance it offers us is overcome by dividing it,” writes the anthropologist Claude Levi-Strauss. He compares this analytic process to the effect of artistic miniatures: “Reduction in scale reverses this situation. Being smaller, the object as a whole seems less formidable. More exactly, this quantitative transposition extends and diversifies our power over a homologue of the thing, and by means of it the latter can be grasped, assessed and apprehended at a glance. A child’s doll is no longer an enemy, a rival or even an interlocutor. In and through it a person is made into a subject.”5 Through miniaturization, the aesthetics of cognitive mapping becomes a way for an individual subject to grasp the complexity of the networked world.
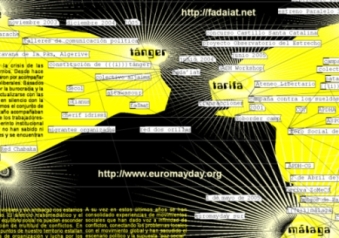
The shift from object to subject propels us from one pole of the compass to its opposite, from hierarchies of power to self-organizing swarms. Howard Rheingold has described this new organizational form, showing how “smart mobs” use mobile devices to coordinate actions in real time.6 But the momentary convergence of mobile, self-organized groups goes back at least to the Zapatista uprising, and was used extensively by the counterglobalization movements. The best examples of what might be called “swarm cartography” have come from activist groups in Spain. “Transacciones/Fadaiat” is a “geography of the geopolitical territory of the Straits of Gibraltar,” compiled in 2004 by independent media producers of the group “Hackitectura,” with collaborations from Tangiers and the Canary Islands. One side is a map of power: on a Mercator projection turned upside-down, it shows sea-going migration routes, refugee camps, destination zones, electronic surveillance systems, military installations, internment centers, etc. But the other side traces a complex meshwork of activist groups on both sides of the Straits, showing their interrelations, their meetings, their evolution over time. The aim is not only to represent, but above all to catalyze a future range of possible interventions by autonomous agents, from direct action protests to immigrant support networks, legal cases, satire, subversion and the production of dissident knowledge. A comparable project was completed in 2004 by activist groups in Barcelona, who created a sophisticated city map to help spark protests against the Universal Forum of Cultures, widely perceived as a mere prop for real-estate speculation along the waterfront.
click detail for whole map
This strategy of diverse, punctual, recurrent interventions was defined by John Arquilla and David Ronfeldt in their study of Zapatista Social Netwar: “Swarming occurs when the dispersed nodes of a network of small (and perhaps some large) forces can converge on a target from multiple directions. The overall aim is sustainable pulsing – swarm networks must be able to coalesce rapidly and stealthily on a target, then dissever and re-disperse, immediately ready to recombine for a new pulse.”7 Arquilla and Ronfeldt’s formulation has been highly influential – first among activists, but then for the U.S. government, after the attacks of September 11. The glaring contradiction of a direct-democratic strategy defined by military experts and utilized by terrorists might encourage us to ask how networked organizations actually emerge in contemporary society, and how in the best of cases they also dissolve entirely, avoiding the destinies of instrumentalization or hierarchical stratification.
The first question shifts us to the right-hand quadrant of our hypothetical map of maps, to explore the constitutive processes that midway lie between swarm phenomena and hierarchical structures. Social network analysis yields insights here, especially when combined with computerized visualization techniques. The maps by Govcom.org use an “Issue Crawler” to analyze a group of websites, discovering common outgoing links (eg. two included sites both linking to a third one, outside the initial group). Thus they identify a larger network of issues. For example, “Ruckus Camp” starts with the websites of forty-nine organizations, whose common links reveal a remarkably consistent set of almost three hundred activist groups. A more complex document entitled “Climate Change” (pdf) displays a densely interlinked cluster of major international organizations at upper right, relatively isolated from a broader meshwork of NGOs, businesses and domestic governmental agencies. The map illustrates the difficulty for bureaucratic hierarchies to interface with ad hoc civil-society initiatives. But can social network analysis be used to portray the full dynamics of network formation?

Ruckus Camp (detail)
An intriguing sequence of diagrams entitled “The case of Sklyarov versus Adobe on the Web” (pdf) shows how a constellation of ephemeral allies comes together to defend a Russian programmer’s hack of a proprietary software application. We see the timeline of a small-scale swarm phenomenon, from constitution to final dispersal. Unfortunately, few network analyses deal with such dynamics. More characteristic is Josh On’s ingenious database project, They Rule, which uses a “friend of a friend” algorithm to generate charts of overlapping membership on the boards of America’s Fortune 100 companies, revealing what are arguably the most robust networks of power in the contemporary world. “They Rule” clearly moves toward the hierarchical maps of contemporary capitalist power compiled by Bureau d’Etudes. But the weakness of all such studies is precisely to focus on what sociologists call “strong ties” – eliminating the play of chance encounters and the insurgency of events that continually reshape social existence.
When power structures coalesce and harden, the specific opposite of network constitution becomes an issue. The last quadrant of our metamap deals with the cartography of dissemination. The idea of a dispersed, subjective cartography is inspired by Michel de Certeau’s opposition between the representational grid of the modern map and the “spatial practices” of walkers in the city, their “opaque and blind mobility,” narrated through word and footstep. “One can follow the swarming activity of these procedures that, far from being regulated or eliminated by panoptic administration, have reinforced themselves in a proliferating illegitimacy.”8 That phrase can perfectly introduce the “Geograffiti” proposal on www.gpster.net, which involves spontaneously recording waypoints with a GPS device and associating them with impressions about what’s on that particular spot – all to be inscribed on a website accessible to the mobile devices of other passers-by. The dream is to retell the story of the world with your ideas and emotions, even while moving through it.
Christian Nold gives that dream another twist, with his Biomapping project. A galvanic sensor is wrapped around a person’s finger, to register the so-called “startle response” that provokes a drop in the electrical resistance of the skin. That information, coupled with continuous waypoint recording by a GPS device, produces a map of the participant’s route through the city in cool green dots, punctuated by bursts of stress or excitement marked in red. Psychogeography goes automatic. But Nold foresees critical applications too: the Biomapping unit could be connected to additional sensors correlating stress response with pollution, radiation, noise levels and so forth.

The most beautiful example of cartography in motion is Esther Polak’s “Amsterdam RealTime: Diary in Traces,” where GPS-equipped pedestrians sketch out the city plan of Amsterdam as a record of their everyday itineraries. Their paths appear as lines of light on a black ground, only to be gradually effaced, giving way to the traces of other walkers. But the work is a fragile gesture, fraught with ambiguity: the individual’s wavering life-line appears at once as testimony of human singularity in time, and proof of infallible performance by the satellite mapping system.
The increasing use of Geographic Information Systems to profile the habits and desires of consuming populations makes clear the ways that corporate networks can now reach in to seize the very flux of subjective difference. A company like iMapData sorts such consumer profiles into precise geographic “envelopes” on a digitized city plan (a political jurisdiction, an infrastructure service zone, an area impacted by a major sports facility, a tourist attraction, a natural disaster, etc.). Web access to these maps is sold to businessmen who want to make strategic marketing decisions on the go. Even more impressive is the integration of such private-sector archives to government databases, themselves keyed to the new biometric passports with which security forces seek to track entire populations caught up in the frenetic mobility of the present. An International Campaign Against Mass Surveillance has been mounted to warn the public of the dangers that may lie ahead.
Notes
2 See the graph and an explanation of the discovery processs at www.caida.org/analysis/topology/as_core_network. I used the 2003 version. The animated map, discussed below, is accessed on the same page (download the flipbook version).
3 François Chesnais, La mondialisation du capital (Paris: Syros, 1994), p. 26; adapted from M. F. Durand, J. Levy and D. Retallé, Le Monde: espaces et systèmes (Paris: Presses de la Fondation des sciences politiques, 1992).
4 Gilles Deleuze, Foucault (London: Athlone Press, 1988), p. 34.
5 Claude Levi-Strauss, The Savage Mind (University of Chicago Press, 1966), p. 23.
6 Howard Rheingold, Smart Mobs (Cambridge, MA: Perseus, 2003).
7 D. Ronfeldt, J. Arquilla, et alii, The Zapatista “Social Netwar” in Mexico (Rand Corporation, 1998), chapter 2, available at www.rand.org/publications/MR/MR994.
8 Michel de Certeau, The Practice of Everyday Life (Berkeley: UC Press, 1984), pp. 91-96.
9 See Michel Foucault, Sécurité, Territoire, Population (Paris: Gallimard/Seuil, 2004), pp. 195-219 and 362-365.
link
brian holmes
http://brianholmes.wordpress.com
Arquitecto, Diseñador de Delitos & Coreografo del Deseo
editor aparienciapublica
www.aparienciapublica.org
http://aparienciapublica
AMERICA has a rest, where you want to be


No hay comentarios.:
Publicar un comentario